
Mobile UA payback
Calculate payback for a mobile acquisition cohort on three separate bases: reported revenue, contribution after costs, and cash actually received.
A cohort reaching 100% reported ROAS has earned revenue equal to its media spend on that report's revenue basis. It has recovered cash only when receipts, less the cash costs you include, cover the acquisition payment. Fees, refunds, servicing costs, and payout dates can move those two events apart.
For a UA lead, the practical question is whether the next cohort can be funded while this one is still returning money. A profitable forecast helps answer whether you want more users. A receipts schedule helps answer when you can afford them.
Decide what the payback date must recover
Write the denominator before calculating a date. Media-spend payback recovers the advertising bill. Fully loaded customer acquisition cost may also include creative production, agency fees, and acquisition payroll. If you include those costs, allocate them consistently and include their payment dates in the cash view.
Likewise, define the numerator. A report may contain gross purchase value, developer proceeds, ad revenue, or a mixture. Calling every one of those values “revenue” does not make them interchangeable.
| Reading | Recovery test | What it lets you say |
|---|---|---|
| Reported-revenue payback | Cumulative reported cohort revenue reaches acquisition cost | The report's revenue basis has covered the chosen cost |
| Contribution payback | Cumulative net revenue, less included variable servicing costs, reaches acquisition cost | The cohort has covered acquisition after those deductions |
| Cash recovery | Cumulative receipts cover acquisition payments and included servicing payments | The cash outlay has been recovered on the stated scope |
These are operating definitions for this guide. Contribution is not company profit: product development, fixed overhead, financing, and taxes may still sit outside it. For mixed monetization, first establish what each revenue stream measures and when it settles.
One cohort reaches three different dates
Consider a fictional cohort acquired on September 1, 2026, day 0. All amounts are USD. This is an arithmetic example, not a customer result or a recommended cost structure.
The assumptions are deliberately simple enough to reproduce:
- Pay $10,000 in media spend on day 0, with no later acquisition charges.
- Record $400 in gross purchase revenue at the end of each day from day 1 through day 50, then no further revenue through day 90.
- Deduct an assumed 25% from purchases for combined revenue deductions. This is an illustrative rate, not an Apple or Google fee schedule. Net proceeds are $300 per earning day.
- Incur and pay $50 in variable servicing costs daily from day 1 through day 60, then no further costs through day 90.
- Receive $6,000 on day 30 for earning days 1 through 20, $6,000 on day 50 for days 21 through 40, and $3,000 on day 70 for days 41 through 50. These are assumed settlements, not provider payout promises.
Acquisition spend, revenue, and costs belong to the same cohort. Every row below is an end-of-day cumulative balance. Cash balance includes the initial $10,000 outflow; contribution excludes it so the recovery threshold remains visible.
| Age | Gross revenue | Net proceeds earned | Servicing costs | Contribution | Cash received | Cash balance |
|---|---|---|---|---|---|---|
| D25 | $10,000 | $7,500 | $1,250 | $6,250 | $0 | -$11,250 |
| D30 | $12,000 | $9,000 | $1,500 | $7,500 | $6,000 | -$5,500 |
| D40 | $16,000 | $12,000 | $2,000 | $10,000 | $6,000 | -$6,000 |
| D50 | $20,000 | $15,000 | $2,500 | $12,500 | $12,000 | -$500 |
| D60 | $20,000 | $15,000 | $3,000 | $12,000 | $12,000 | -$1,000 |
| D70 | $20,000 | $15,000 | $3,000 | $12,000 | $15,000 | $2,000 |
Reported gross ROAS first reaches 100% on D25. Contribution reaches $10,000 on D40. Cash first becomes nonnegative on D70. The same users produce all three dates; only the measurement basis changes.
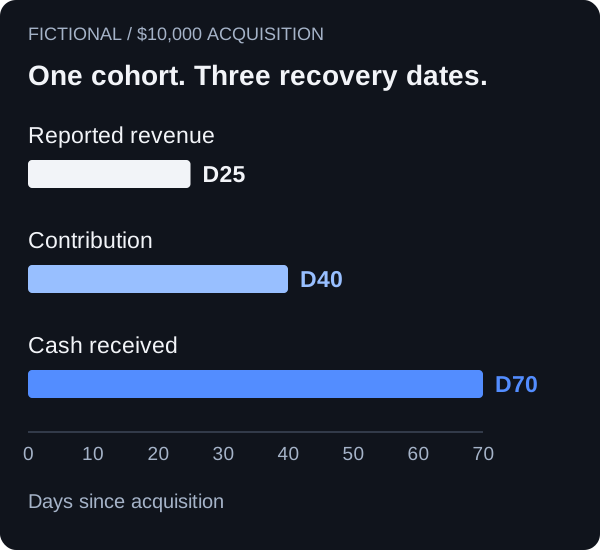
The gap is inspectable. At D50, the cohort has earned $15,000 in net proceeds but received $12,000. The $3,000 receivable is still outstanding. Meanwhile, the $2,500 servicing bill has already been paid. Hence $12,000 minus $10,000 minus $2,500 leaves a $500 cash deficit, despite 200% gross ROAS.
Download the complete daily ledger to check the crossings or replace the assumptions. It includes daily flows and cumulative balances from D0 through D90, plus a lower-revenue scenario.
Calculate the first crossing without inventing precision
For a fixed acquisition cost, scan the daily ledger in date order:
contribution_to_date = net_proceeds_earned_to_date - servicing_costs_to_date
cash_balance = receipts_to_date - acquisition_payments_to_date - servicing_payments_to_date

revenue_payback = first day reported_revenue_to_date >= acquisition_cost
contribution_payback = first day contribution_to_date >= acquisition_cost
cash_recovery = first day cash_balance >= 0 after acquisition payment
Use actual daily observations if you need a daily result. A D30 value below the threshold and a D60 value above it only locate the crossing inside that interval. A straight-line interpolation is an estimate; it is not an observed D43 payback.
Also check the balance after the first crossing. Refunds, later costs, or adjustments can take it below the threshold again. In this example contribution falls from $12,500 at D50 to $12,000 at D60 because servicing continues after revenue stops. It stays above acquisition cost, but the decline shows why the first crossing alone is incomplete.
Keep the observed cutoff beside the result. “First recovered at D70 and remained nonnegative through D90” is narrower and more useful than “paid back forever.”
Put receipts on calendar dates
Provider settlements do not necessarily arrive a fixed number of days after each user installs or purchases.
Apple states that, when its agreement, banking, minimum payment threshold, and applicable invoicing requirements are met, payments are made within 45 days after the end of the fiscal month in which the transaction completed. That is a fiscal-month rule, not a promise of cash 45 days after each purchase. Apple also describes consolidated proceeds and possible bank charges. See its payment requirements and timing.
AdMob likewise distinguishes finalized earnings from payment processing and receipt, with timing dependent on the payment method and account conditions. Use the applicable AdMob payment schedule, rather than treating estimated earnings as a bank balance. Provider documentation was checked September 6, 2026.
A settlement can cover revenue from many acquisition cohorts. Match it to the financial report first. If that report cannot identify each cohort's share, allocate using a documented method, reconcile the shares to the receipt, and label cohort cash as allocated. Do not imply that a bank transfer carries an attribution label.
For the funding decision, the total cash schedule can still be useful even when cohort allocation is uncertain. Use receipt dates, currencies, withholding, refunds, and acquisition invoice due dates as they actually apply. The fictional example pays acquisition upfront; invoice terms would change its cash curve.
An unrecovered cohort needs an honest result
Now reduce gross revenue to $250 per earning day, keeping the earning period, deduction rate, and servicing costs unchanged. Total gross revenue is $12,500. Net proceeds are $9,375. After $3,000 in servicing costs, contribution is $6,375.
That cohort reaches 100% gross ROAS on D40 but does not recover acquisition cost on either contribution or cash through D90. Its final cash balance is -$3,625. Both scenarios appear in the download.
For a real cohort observed only through D90, that result means “not recovered by D90.” Revenue after D90 is unknown unless you explicitly add a forecast. A model estimating a D150 crossing should report “predicted D150 recovery, using actuals through D90,” with its assumptions and uncertainty. If the projected curve never crosses within the forecast horizon, return that outcome instead of extending the curve until it does.
Do not average payback days across only the cohorts that recovered. That omits the failures. Report how much acquisition spend has recovered, how much remains unrecovered, and how old the unrecovered cohorts are.
Price the cash gap before increasing spend
In the first scenario, the deepest end-of-day deficit is $11,450 at D29, immediately before the first settlement day. Funding just the $10,000 media bill would leave $1,450 of included costs unfunded before any receipts arrive. This excludes overhead and any intraday payment ordering.
For an acquisition plan, combine the dated outflows and receipts for every overlapping cohort. The largest cumulative deficit is the funding requirement under those assumptions. Add any operating reserve separately so the reader can see which amount comes from the model and which comes from policy.
Before raising spend, record the revenue basis, cost scope, forecast cutoff, expected recovery date, and cash shortfall under a slower-receipts or lower-revenue scenario. A delayed receipt can increase funding needs without changing the cohort's contribution. Lower revenue can change both.
If the next decision is an early network target, use the guide to calibrating a D7 ROAS target. It addresses how to derive the threshold from mature cohorts; the cash ledger addresses whether the acquisition plan can be funded while waiting.
Lemon AI's Predictive Analytics shows predicted cohort returns at a named horizon. Use that forecast as revenue context, then reconcile costs and receipts separately for a cash-recovery decision. The cohort forecasting guide and measurement methodology explain the boundaries between observed and predicted outcomes.
Sources and example scope
- Apple: Overview of receiving payments
- Google AdMob: Payments and transactions
- Daily synthetic ledger, including the unrecovered scenario
All example amounts, earning patterns, deduction rates, costs, and settlement dates were constructed for this explanation. No client data, observed industry benchmark, or measured Lemon customer result is used.