
Cohort reporting lag
A Cohort Report Finishes Two Days After Its Window
We replayed 58,587 readings of AppLovin cohort reporting. Every column reaches 99% of its settled value about two days after its window closes.

By Gregory Potemkin
Founder & CEO
Published
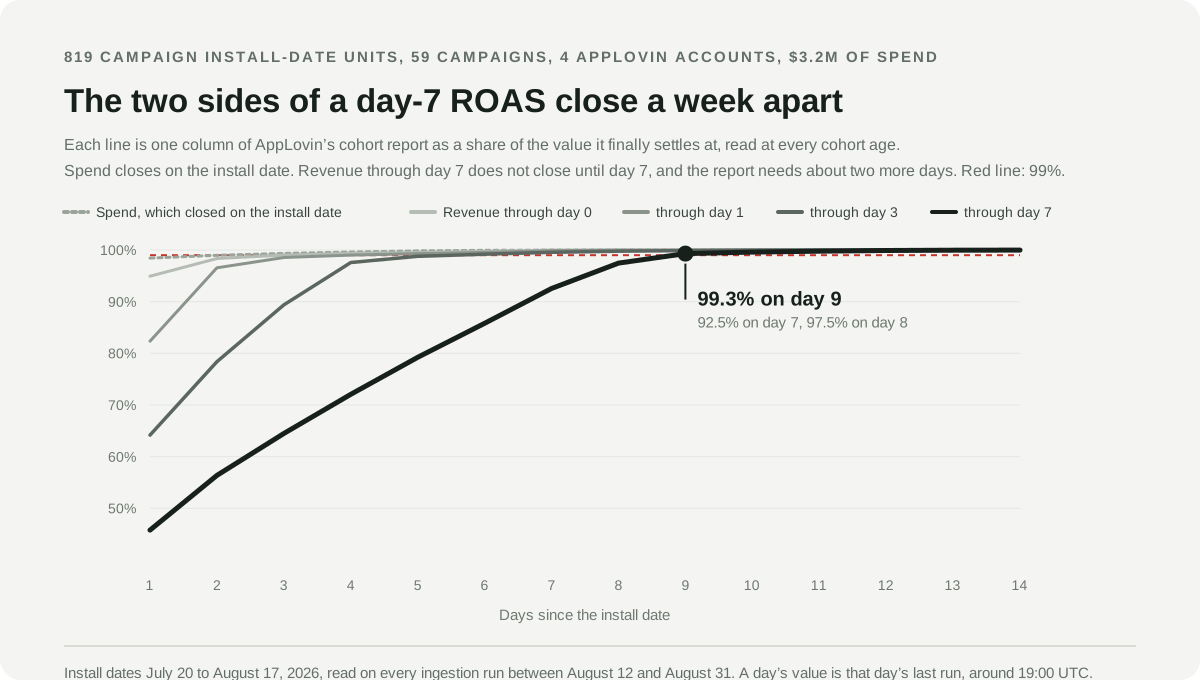
A day-7 ROAS divides a number that finished on the install date by a number that does not finish for another week, and neither side is reported the moment it happens. We replayed 58,587 readings of AppLovin’s advertiser cohort report, taken across 298 retained ingestion runs and covering 819 campaign install-dates, 59 campaigns and $3.2 million of spend, and measured when each column stops moving. Every column, spend included, reaches about 99% of its settled value roughly two days after its own window closes. A day-7 revenue figure is therefore 92.5% of itself on day 7, 97.5% on day 8 and 99.3% on day 9. Read it earlier and the error runs one way: against an 8% day-7 ROAS bar, 26.2% of the creative sets that clear the bar once settled fail it on the read a team has the morning after the window closes, and none go the other way.
Nothing about the campaigns has to change for this to move your numbers. Only the age of the cohorts inside the report does.
The same two weeks, read twice, changed sign
On the morning of August 18, 2026 the trailing seven install days on this panel looked worse than the seven before them. Twenty-nine campaigns ran in both weeks and appear in both reads.
| August 11 to 17 | August 4 to 10 | Change | |
|---|---|---|---|
| Day-7 ROAS as reported on August 18 | 9.25% | 10.27% | down 9.9% |
| The same two weeks, once settled | 12.72% | 10.31% | up 23.4% |
The week that looked like a 10% decline was a 23% improvement. The older week is the proof that nothing else moved: read on August 18 it showed 10.27%, and its final value is 10.31%. It was already finished. Only the newer week was still arriving.
Read the raw account totals instead of matched campaigns and the same thing happens with a flatter face: 44 campaigns showed 9.44% against 9.60%, a 1.6% dip, where the settled answer is 13.00% against 9.64%, a 34.9% rise. Either way the sign is wrong.
A cohort number is short for two different reasons, and only one of them is a surprise
A day-7 revenue figure for Monday’s installs cannot be complete on Tuesday. The cohort has lived one day. Six days of its spending have not happened yet. That is the definition of the metric, not a defect, and everyone who works with cohorts knows it.
The second reason is the one nobody publishes a number for. When the window does close, the report is still not finished. Revenue that has already happened has not arrived in the report yet.
These two are easy to confuse and easy to separate, because AppLovin’s cohort report carries four windows that close on four different days, plus a spend column that closes with the install date itself. Line each column up against the close of its own window and the definitional part drops out. What is left is the lag.
| Hours since that column’s window closed | Revenue through day 0 | through day 1 | through day 3 | through day 7 | Spend |
|---|---|---|---|---|---|
| 0 to 6 | 75.8% | 87.0% | 92.2% | 94.0% | 96.9% |
| 12 to 18 | 89.5% | 94.6% | 96.2% | 97.4% | 98.2% |
| 18 to 24 | 94.9% | 96.6% | 97.6% | 98.5% | 98.4% |
| 24 to 30 | 97.1% | 97.6% | 98.2% | 99.0% | 98.6% |
| 42 to 48 | 98.4% | 98.6% | 98.8% | 99.4% | 99.0% |
| 66 to 72 | 99.0% | 99.0% | 99.2% | 99.6% | 99.3% |
| 120 to 126 | 99.6% | 99.6% | 99.9% | 99.9% | 99.9% |
Five columns, five different closing days, one shape. Somewhere between 1.5% and 5% of the value is still outstanding a day after a window closes, about 1% after two days, and under 1% after three. The shortfall is larger for the shorter windows because a late-arriving tail is a bigger share of a smaller total. Spend behaves like the rest, which is what tells you this is the report catching up rather than users spending money. At ingestion-run resolution the day-7 curve is monotone across all 57 six-hour buckets from a week before its close to a week after.
So the practical rule for this report is the window plus two days. Day-7 revenue is readable on day 9.
The documented answer is seven days, and it is a day or two short
Adjust documents the distinction precisely: “The immature cohort shows the accumulated data so far for the cohort period,” while the mature cohort “only shows data for periods that have elapsed in full.” Its maturity rule is that every user must “have had your app installed or have been reattributed for at least 7 days.” That is the definitional half, stated correctly. It does not cover the lag.
Nobody else covers it either. AppLovin’s advertiser Reporting API documents the total_rev_«x» and sales_«x» columns and the cohort mode that returns them, and says nothing at all about freshness, completeness or restatement. AdMob’s cohort report help allows that “in some cases, there could be a data processing delay that causes D0 to be less than 100%,” without saying how long. Mintegral’s cohort documentation gives the calendar boundary instead: “If a user installs the app at 11 PM on July 1st, their D0 ROAS will be considered mature at midnight on July 2nd.” On the panel measured here, a day-0 figure read six hours after that midnight is at 75.8%. All four statements are verified September 1, 2026.
None of them is wrong. They describe when the cohort is finished, not when the report is.
What the report actually shows at each cohort age
This is the view a dashboard gives you, with both effects present, because that is what you are reading.
| Cohort age | Revenue through day 0 | through day 1 | through day 3 | through day 7 | Spend | Day-7 buyers |
|---|---|---|---|---|---|---|
| 1 | 94.9% | 82.3% | 64.2% | 45.8% | 98.4% | 26.9% |
| 2 | 98.4% | 96.6% | 78.4% | 56.4% | 99.0% | 37.9% |
| 3 | 99.0% | 98.5% | 89.4% | 64.5% | 99.3% | 48.2% |
| 4 | 99.3% | 99.0% | 97.6% | 72.1% | 99.6% | 59.1% |
| 5 | 99.5% | 99.3% | 98.8% | 79.2% | 99.8% | 69.6% |
| 6 | 99.7% | 99.5% | 99.2% | 85.8% | 99.9% | 79.9% |
| 7 | 100.0% | 99.9% | 99.6% | 92.5% | 100.0% | 89.9% |
| 8 | 100.0% | 100.0% | 99.8% | 97.5% | 100.0% | 97.4% |
| 9 | 100.0% | 100.0% | 99.9% | 99.3% | 100.0% | 98.8% |
| 10 | 100.0% | 100.0% | 100.0% | 99.6% | 100.0% | 99.3% |
| 12 | 100.0% | 100.0% | 100.0% | 99.9% | 100.0% | 99.8% |
| 14 | 100.0% | 100.0% | 100.0% | 100.0% | 100.0% | 100.0% |
Each value is that column as a share of the value it eventually settles at, on 819 campaign install-dates from July 20 to August 17, 2026, across four AppLovin advertiser accounts and $3.2 million of spend. Every unit is compared against its own settled value, so a large campaign cannot drag the curve through a small one’s revenue. A stricter variant that holds one set of 183 units fixed at every age puts day 7 at 90.7% and day 9 at 99.4%. The early ages move with the convention; the settling age does not.
The shape of the first week is your app’s, not the network’s. One account in this panel has 99.4% of its day-7 revenue on day 1, because its users pay on install day and there is almost nothing left for the week to add. Another is at 10.4% on day 1 and 77.8% on day 7. That is the difference between two revenue curves, and it means the “how long before I can judge a cohort” half of the question cannot be borrowed from anyone. All four accounts agree by day 9, because that half is the report, and the report is the same for everyone on it.
Google Ads settles on a faster clock
The same replay on Google Ads, where Lemon keeps the same snapshot history. Google reports conversions by lag from the ad interaction rather than by days after install, so these are not the same quantity as AppLovin’s columns. They are an independent check that a network report fills in and then stops.
| Window | Units | Day 1 | Day 4 | Day 5 | Day 6 | Day 7 | Day 8 | Day 10 |
|---|---|---|---|---|---|---|---|---|
| Lag under 1 day | 948 | 90.2% | 98.3% | 99.7% | 99.9% | 99.9% | 99.9% | 100.0% |
| Lag under 2 days | 970 | 84.3% | 98.1% | 99.5% | 99.7% | 99.8% | 99.8% | 100.0% |
| Lag under 4 days | 994 | 73.6% | 97.6% | 99.3% | 99.6% | 99.8% | 99.8% | 100.0% |
| Lag under 8 days | 1,002 | 64.1% | 86.5% | 91.1% | 94.7% | 97.6% | 99.9% | 100.0% |
Google’s eight-day window is 99.9% complete on day 8, the day it closes. AppLovin’s seven-day column is 92.5% on day 7. Same behavior, different lag, and no reason to expect a third network to match either. Unity Ads is in the panel too, but with two accounts and fourteen campaigns no campaign appeared at every age, so it carries no curve here and none is claimed.
What your lookback window is reporting
Write f(a) for the share of a cohort’s settled day-7 revenue that the report shows at cohort age a, the last column of the table above. For a set of install dates W read at time T, reported revenue is the sum over W of f(T-d) times the settled revenue for install date d, while reported spend is already settled. So:
reported day-7 ROAS   sum of f(age) * settled revenue
------------------- = -------------------------------
 settled day-7 ROAS      sum of settled revenue
The reported number is the settled number multiplied by a revenue-weighted average of the fill-in curve over the ages inside the window. There is nothing to fit and nothing to calibrate. Read on August 18 on this panel:
| Lookback window | Reported as a share of settled |
|---|---|
| Last 7 days | 72.7% |
| Last 14 days | 84.2% |
| Last 30 days | 92.0% |
On this panel a seven-day lookback on a day-7 metric shows roughly three quarters of the settled number, and it does so every day. It is not a trend. It is the window.
That average is also not a correction factor you can apply. Across 29 campaigns in a thirteen-day window, the reported share of settled day-7 ROAS ranged from 4.3% to 100.0%, with a median of 90.8% and a tenth percentile of 47.9%, on spend that was itself 99.7% settled. The identity above says why: the ratio is a revenue-weighted average of the curve over the ages inside the window, so a campaign whose window revenue sits mostly on its youngest cohorts falls furthest below its settled value. That is a different set of campaigns every week.
Inside one window the ranking mostly survives
Here is the reassuring half, and it is worth stating as plainly as the rest. We ranked creative sets by day-7 ROAS over one fixed window of install dates, first on the morning after the window closed and again once every cohort in it had settled, and compared the top quarters.
| Settled spend floor | Creative sets | Top-quarter agreement | Control | Chance |
|---|---|---|---|---|
| None | 999 | 95.2% | 100.0% | 25.0% |
| $250 | 443 | 83.8% | 100.0% | 25.1% |
| $500 | 354 | 84.1% | 100.0% | 24.9% |
| $1,000 | 274 | 86.8% | 100.0% | 24.8% |
| $2,500 | 140 | 91.4% | 100.0% | 25.0% |
The control is two settled reads taken a day apart, where nothing changed at all, and it agrees perfectly. Against a chance line of 25%, the early read keeps 84% to 95% of the top quarter. That makes sense: every creative set inside one window carries the same spread of cohort ages, so they are all pulled down together, and a ranking survives being multiplied by roughly the same number.
If your question is “which of these is best,” an early read is mostly safe. That is not the question most UA teams actually ask.
An absolute bar is where it costs money
A kill rule is not a ranking. It is a line, and an unsettled read moves every creative set toward it from above. On 362 creative sets carrying $1.24 million of settled spend in the same window:
| Day-7 ROAS bar | Clear it settled | Would have failed it on the morning read | False-cut rate | Control | Spend on the falsely cut |
|---|---|---|---|---|---|
| 2% | 269 | 26 | 9.7% | 0.0% | $77,756 |
| 4% | 226 | 27 | 11.9% | 0.0% | $64,984 |
| 6% | 196 | 41 | 20.9% | 0.0% | $90,537 |
| 8% | 160 | 42 | 26.2% | 0.0% | $122,299 |
| 10% | 129 | 41 | 31.8% | 0.0% | $149,424 |
| 12% | 106 | 31 | 29.2% | 0.0% | $112,079 |
| 15% | 70 | 16 | 22.9% | 0.0% | $47,452 |
| 20% | 41 | 5 | 12.2% | 0.0% | $7,594 |
At an 8% bar, 42 of the 160 creative sets that clear it once settled would have been cut. The control, the same test run between two settled reads, cuts nothing at any bar. And the error only points one way: the number of creative sets that fail the bar once settled but clear it on the early read is zero at every bar tested. An unfinished report can only make something look worse than it is, so the mistake it produces is always a false kill, never a false scale.
The rate peaks in the middle of the distribution, near a 10% bar, because that is where the most creative sets are sitting close enough to the line for a few missing percent to push them across it. If your bar happens to sit where your creative sets cluster, this is at its worst.
Once it settles, it stays settled
The fear this measurement usually triggers is that the numbers never stop moving. On this panel they stop. Across 117 units watched at every age from 14 to 28 days, day-7 revenue moved from 99.995% of its day-28 value to 100.000%, and spend did not move at all. Within a month of the install date there is no measurable restatement after settling on either column.
That matters for what you do about this. The problem is not that cohort data is untrustworthy. It is that it arrives on a schedule, and the schedule is short and knowable.
Measuring your own settling age
You need two reads of the same request, separated in time. Most teams already have the first one and throw it away.
- Pick a fixed set of install dates, at least two weeks of them, and a fixed grain: campaign or creative set, plus country if you slice by it.
- Pull your network’s cohort report for exactly that request and save the response with a timestamp. Do it again every day for two weeks without changing the request.
- For each install date and each snapshot, compute the cohort age and the value of each cumulative column as a percentage of the value in your last snapshot.
- Look at the spend column first. It closes on the install date, so its curve is your reporting lag with nothing else mixed in.
- Read the age at which your day-N column reaches whatever tolerance you can live with. One percent is a reasonable place to start.
- Then exclude cohorts younger than that age from every comparison, every alert and every kill rule. Not from the dashboard, which can keep showing them, but from anything that triggers a decision.
Two weeks of saved responses is enough to get an answer, and the answer only changes when your network changes its pipeline. If you have an ETL that overwrites yesterday’s pull, stop overwriting it. The snapshot history is the measurement.
The cheap version, if two weeks of waiting is too slow: exclude install dates younger than your longest window plus two days, and re-check in a quarter. On both networks measured here that rule is safe and costs you almost nothing, because the cohorts it excludes were never going to give you an honest read anyway.
What this does not establish
The panel is four AppLovin advertiser accounts and the Google Ads accounts Lemon connects, over install dates from July 20 to August 17, 2026. Lemon’s retained ingestion history begins August 12, 2026, which caps how far back a cohort can be watched and is why the post-settling check stops at 28 days. A settled value here means the last snapshot at least 14 days after the install date, not a value observed forever.
This does not measure whether a day-7 number, once settled, tells you anything useful about day 30 or day 365. That is a different question, and what waiting from D7 to D30 actually buys measures it on a separate panel. It does not establish a settling age for Meta, Unity, Mintegral, TikTok or any network not in this panel, and the AppLovin and Google results differ enough that guessing would be careless. It says nothing about MMP cohort reporting, which runs on its own pipeline. And a day-7 window is short: a longer window such as day-30 or day-90 gives late revenue more room to arrive, and this panel cannot see whether the two-day rule holds out there.
The one thing it does establish firmly is the direction. An unfinished cohort report understates. It never flatters.
Where Lemon fits
Nothing above requires Lemon. It is a folder of dated report pulls and a subtraction, and the conclusion is a change to when you read the table rather than to what you buy.
What Lemon removes is the reason most teams never have the folder. Every ingestion run of every connected network’s report is retained with the time it ran, which is the only reason this article could be written from production history instead of a simulation. That history is what lets a cohort figure carry its own age, so a week-over-week comparison in Creative Analytics compares settled numbers rather than reporting schedules. Where a cohort genuinely has not matured yet, Cohort Prediction labels the forecast as a forecast and keeps it visually separate from what the network reported, and our methodology states which is which.
For the wider discipline, start with cohort revenue forecasting for mobile apps. Once your reads are settled, what waiting from D7 to D30 actually buys tells you which cohort age to decide at, and when ad revenue, IAP and subscription LTV become final covers the restatement schedules each revenue stream’s own provider documents.