
Forecast audit protocol
Test an LTV or revenue forecast for future leakage, misleading error averages, weak coverage, and unsafe budget decisions.
A trustworthy cohort forecast backtest must recreate the decision that would have been made when the cohort was still immature. Fix the forecast origin, expose only the data available at that time, hide the mature outcome, score every eligible cohort, and report error, bias, coverage, and budget-decision accuracy by the segments where spend moves.
An impressive percentage without those facts is not enough. A model can appear accurate because later cohorts leaked into training, failed predictions disappeared from the denominator, or one global average concealed a market where the forecast repeatedly overpredicted revenue.
This protocol applies to mobile app and game forecasts for LTV, revenue, ROAS, and payback. It audits the evaluation, not the model architecture.
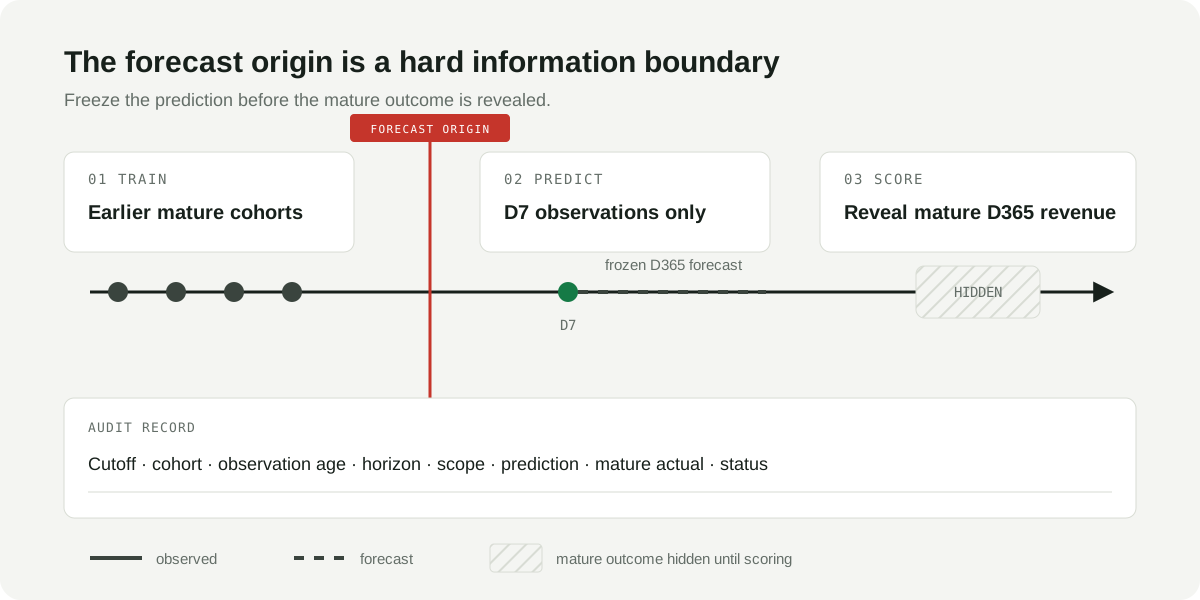
The forecast origin is a hard information boundary. The mature outcome can score the prediction later, but it cannot influence the prediction.
A good backtest recreates the decision, not the final dataset
Start with four dates or horizons:
| Field | What it fixes |
|---|---|
| Acquisition period | Which users belong to the cohort |
| Forecast origin | The calendar time at which the historical decision is simulated |
| Observation age | How much user behavior is visible, such as D3 or D7 |
| Target horizon | The mature result to predict, such as D90 or D365 |
Suppose a UA team wants to decide at D7 whether a campaign will clear its D365 ROAS target. The backtest must predict each historical cohort using only the features, definitions, model state, and source corrections that existed by D7. D365 revenue stays hidden until scoring.
This is stricter than sorting a finished table into training and validation rows. A feature can leak future information even when the target column is absent. Examples include a user status calculated after D7, a campaign label revised after the forecast origin, a normalization fitted on the full period, or a model selected after inspecting the holdout result.
Restated revenue is the same failure in a less obvious form. Ad revenue reporting in particular is delivered early and corrected for days afterwards, so a D7 feature built from a version of the data published two weeks later contains information the historical decision could not have had. When each revenue number is final sets out the restatement schedules per revenue stream.
Official scikit-learn forecasting documentation demonstrates the mechanism on a time-ordered dataset: a shuffled split produces an overly optimistic error estimate, while a time-aware split better represents prediction on future observations. Mobile LTV models are not all conventional time-series models, so the rule is not “always use one splitter.” The rule is that no feature, transformation, label, or model choice may see beyond the simulated decision time.
Draw a boundary future data cannot cross
A defensible evaluation can use one chronological holdout or several rolling forecast origins. Rob Hyndman’s tsCV documentation describes the rolling version: train on a historical prefix, forecast a later horizon, move the origin forward, and repeat.
For each origin, save a frozen evaluation record before revealing the target:
- Model and feature-definition version.
- Training cutoff and training cohort range.
- Acquisition cohort and comparison scope.
- Forecast origin and observation age.
- Target horizon and revenue definition.
- Predicted value or an explicit withheld status.
- Mature actual value, added only when the horizon completes.
The record also needs app, platform, country, media source, campaign type, currency, attribution basis, and spend when those fields affect the budget decision. A percentage detached from that scope cannot tell a UA lead whether the result applies to the campaign in front of them.
Make one cohort auditable before calculating an average
For one cohort, absolute percentage error is:
absolute percentage error = |predicted value - actual value| / |actual value|
If a D365 forecast is $108,000 and mature attributed revenue is $100,000, the absolute percentage error is 8%.
That row is still incomplete without its origin. “Predicted D365 revenue: $108,000” must mean something like “predicted on D7 using data available through D7 for the January acquisition cohort.” Otherwise the reader cannot reproduce the decision or check leakage.
The following worked example is synthetic. It teaches the audit arithmetic and does not represent a Lemon customer, model run, or benchmark.
| Cohort | Spend | Predicted D365 revenue | Mature D365 revenue | Absolute percentage error | MAPE status |
|---|---|---|---|---|---|
| January | $90,000 | $108,000 | $100,000 | 8% | Eligible |
| February | $65,000 | $54,000 | $60,000 | 10% | Eligible |
| March | $31,000 | $33,000 | $30,000 | 10% | Eligible |
| April | $12,000 | $13,000 | $10,000 | 30% | Eligible |
| May | $5,000 | $1,500 | $500 | 200% | Below the predeclared $10,000 actual-revenue floor |
| June | $24,000 | Withheld | $32,000 | N/A | Required input coverage failed |
| July | $52,000 | $45,000 | $50,000 | 10% | Eligible |
The near-zero May actual makes its percentage error enormous. The June prediction failed, so no error exists to average. Neither row should vanish. May remains part of absolute-error and failure analysis. June remains part of coverage. The MAPE eligibility rule must be declared before anyone sees which rows it helps or hurts.
One percentage cannot describe forecast quality
The five MAPE-eligible rows above produce four different views of the same backtest:
| Measure | Synthetic result | Question it answers |
|---|---|---|
| MAPE | 13.6% | How large was the typical eligible cohort’s percentage miss when every cohort had equal weight? |
| Spend-weighted absolute percentage error | 10.24% | How large was the miss after higher-spend cohorts received more influence? |
| Signed aggregate bias | +1.2% | Did the eligible forecasts overpredict or underpredict revenue in total? |
| Prediction coverage | 85.7% | For how many cohorts did the system return any prediction? |
MAPE is the mean of 8%, 10%, 10%, 30%, and 10%, which is 13.6%. The weighted result is lower because the largest cohort also has the smallest error. Weighting is not automatically better. It answers a different question.
MAPE also becomes unstable when actual values approach zero. The official scikit-learn MAPE reference notes that a near-zero actual can produce an arbitrarily large value. Report an absolute error or a predeclared alternative for those rows, and disclose how many rows were excluded from MAPE.
Coverage belongs beside error because a model can improve its reported error by declining hard cases. Report at least:
- prediction coverage before error eligibility rules;
- MAPE eligibility coverage after the near-zero rule;
- missing-input and model-failure counts;
- the same figures by decision-critical segment.
In the example, prediction coverage is six of seven cohorts, or 85.7%. Only five of seven cohorts, or 71.4%, enter MAPE. Reporting 13.6% without those denominators would overstate the evidence.
Break the result where the budget decision changes
A global average is a starting point. Split the result along the dimensions used to move spend:
- forecast horizon and observation age;
- app and monetization model;
- platform and country;
- media source and campaign type;
- spend or install scale;
- acquisition period and product version.
Official mobile forecasting documentation describes why this matters. GameAnalytics advises comparing cohorts and comparable user segments, and distinguishes measured LTV from predicted continuation. Appodeal identifies cohort size, observation age, app updates, monetization changes, and new traffic sources as factors that can change forecast accuracy.
Those are failure modes to test, not universal effect sizes. Your backtest should show whether the model remained useful after the changes that actually occurred in your app.
Inspect signed bias within every material segment. A country that is consistently overpredicted can keep winning budget while missing payback, even when errors elsewhere cancel it in the global average.
Test the budget call, not only the revenue estimate
Forecast error and decision accuracy are related but not identical. A small miss can reverse the action when predicted ROAS sits close to the profitability threshold. A larger miss may leave an obvious winner or loser on the same side of the line.
In the synthetic example, define “scale” as predicted D365 revenue at least equal to spend. The forecast and mature result agree on the action for January, February, and July. They disagree for March and April. Decision accuracy is therefore three of five eligible cohorts, or 60%, even though spend-weighted percentage error is 10.24%.
That does not prove the model is good or bad. It proves that a point-error metric cannot answer the budget question alone.
The same distinction applies before a model is involved at all. Ranking media sources by observed cumulative ROAS at an early age and again at maturity turns forecast quality into a decision question you can answer with a count, and the age at which that ranking settles is worth measuring on your own cohorts before you decide how much a forecast has to add.
Set the operating rule before scoring:
- Name the target horizon and observation age.
- Set the profitability threshold and a hold band around it.
- Require minimum prediction and metric-eligibility coverage.
- Set accepted error and signed-bias bands for the relevant segment.
- State what happens when required data is missing or the forecast falls inside the hold band.
- Re-run the evaluation after material traffic, product, pricing, or monetization changes.
A useful rule might scale only when the lower end of an accepted error range remains above the ROAS target. When the result crosses the target under a plausible miss, hold spend or gather more observations.
Use the D7 ROAS target decision guide to calibrate an early threshold on mature cohorts, freeze it, and test the scale, hold, and cut calls on a later untouched period.
Lemon proves the forecast on your history before activation
Lemon Cohort Prediction combines user features with action sequences to predict user value, then aggregates those predictions into cohort revenue, ROAS, ARPU, and payback. The model architecture is described in U.S. Patent 12,014,278 B1.
Setup includes a blind historical backtest before the forecast workspace is activated. Lemon’s published product range is 5% to 10% MAPE at D365. That is a product-specific claim, not an industry benchmark and not the result of the synthetic example above. An app-specific review should still expose the evaluation period, cohort scope, coverage, segment errors, and budget-decision rule.
Read the broader cohort revenue forecasting guide, review Lemon’s measurement and forecasting methodology, or see how Cohort Prediction runs the backtest during setup.
Primary sources
- scikit-learn time-aware forecasting evaluation
- scikit-learn mean absolute percentage error
- Time series cross-validation in the forecast package
- GameAnalytics predicted LTV documentation
- Appodeal revenue forecast documentation
- Lemon AI cohort prediction patent
On this page
- A good backtest recreates the decision, not the final dataset
- Draw a boundary future data cannot cross
- Make one cohort auditable before calculating an average
- One percentage cannot describe forecast quality
- Break the result where the budget decision changes
- Test the budget call, not only the revenue estimate
- Lemon proves the forecast on your history before activation
Related product