
Creative measurement protocol
Audit asset-level creative ROAS for provenance, scope, cohort maturity, aggregation, and decision strength before scaling or pausing an ad.
Do not scale or pause a creative from an asset-level ROAS column until five facts are clear: who reported each input, whether spend and revenue cover the same scope, which maturity and attribution horizon the value uses, whether the rows are additive, and what conclusion the evidence can support. If any answer is missing, the table is not decision-ready.
ROAS looks simple because the formula is simple. Attributed revenue divided by ad spend gives a ratio. The hard part is proving that the numerator and denominator describe the same asset, app, market, period, attribution basis, and maturity horizon.
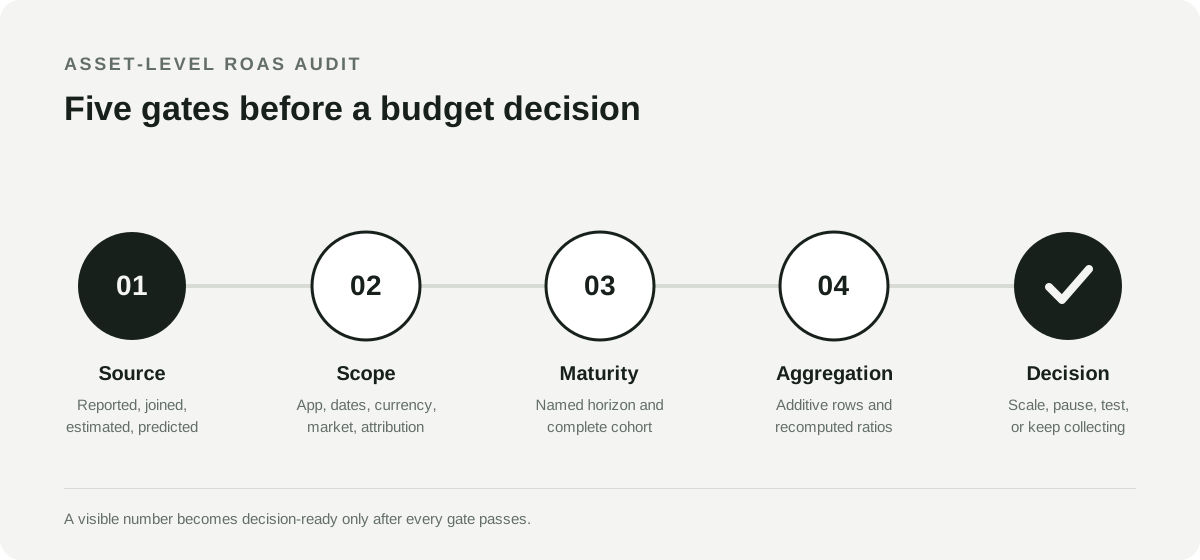
Five gates separate a visible ROAS number from a defensible creative decision.
| Gate | Question | Stop if |
|---|---|---|
| Source | Who reported or estimated spend and revenue? | The table presents every value as if it came from the network |
| Scope | Do the inputs cover the same app, dates, currency, market, and attribution basis? | One dimension is missing, inferred, or silently broadened |
| Maturity | Is the selected D0, D7, or D30 cohort complete? | Recent cohorts are compared with mature cohorts without a partial-data warning |
| Aggregation | Can the asset rows be summed, and are ratios recomputed? | The dashboard averages ROAS or treats non-additive rows as account totals |
| Decision | Does the evidence support ranking, scaling, pausing, or a causal claim? | A modeled or attributed relationship is described as independent creative lift |
First identify who reported each number
An asset row can contain values with different provenance. The network may report the asset ID, impressions, clicks, and spend. Installs or revenue may come from a broader network report, an MMP, an advertiser warehouse, or an estimation system. ROAS may then be derived from those aligned inputs.
AppLovin is a useful example. As verified on August 11, 2026, its Asset Reporting API documents asset identity, campaign and creative-set identifiers, impressions, clicks, cost, and CTR. Its documented asset fields do not include installs, purchases, revenue, CPI, CPA, or ROAS.
AppLovin’s separate advertiser Reporting API exposes campaign and creative-set dimensions alongside conversion, sales, purchaser, revenue, and ROAS fields. Combining those reports can produce a useful asset decision surface, but the combined result is not suddenly a native Asset API fact.
Require one of these provenance labels for every consequential value:
- Network-reported: returned directly at the displayed asset grain.
- Joined: attached through a stable relationship supported by the source data.
- Reconstructed or estimated: calculated because the source does not expose the outcome at the displayed grain.
- Predicted: forecast beyond the outcomes observed so far.
- Derived: recomputed from named inputs, such as revenue divided by spend.
The labels are not implementation detail. They tell the UA lead what the number can safely support.
Align the scope before comparing creatives
Two correct source values can produce a wrong ROAS when their scopes differ. Before comparing assets, verify the following fields:
| Scope field | What must match |
|---|---|
| App and account | The same promoted app and advertising account |
| Date boundary | The same reporting dates and timezone |
| Currency | The same source currency or a declared conversion basis |
| Campaign context | The same objective and relevant campaign structure |
| Market | The same country and platform scope |
| Attribution | The same click-through, view-through, re-engagement, and deduplication rules |
| Revenue definition | The same IAP, ad revenue, subscription, or combined value basis |
| Horizon | The same D0, D7, D30, or longer cohort window |
A dashboard should withhold or flag a comparison when it cannot align a material field. Filling a missing dimension with a plausible default produces false precision, not more complete reporting.
Attribution and horizon are the two rows teams most often assume are aligned when they are not. What each ad network’s D7 column actually measures sets out the differences across the supported networks, including which of them publish a finalization rule at all.
The market row hides a third trap when the scope is iOS. Apple’s postbacks resolve a creative only in the first conversion window, so an iOS asset-level outcome is always joined or reconstructed rather than network-reported, whatever provenance label the dashboard prints.
This is also why an asset name is a weak join key. Teams rename files, reuse filenames, and upload the same media more than once. A trustworthy system retains the network, account, campaign, creative set or ad, stable asset ID, observation date, and media identity separately.
Match the ROAS horizon to the cohort’s maturity
D0, D7, and D30 ROAS answer different questions. D0 measures the earliest monetization signal. D7 adds outcomes observed during the first seven days after acquisition. D30 includes a longer part of the revenue curve. None should appear as an unlabeled ROAS column.
The reporting date is not enough to establish maturity. If a report runs on August 11, a cohort acquired on August 10 cannot have a complete D7 outcome. A decision surface should expose:
- the selected outcome horizon;
- the latest successful source update;
- the acquisition dates that have fully matured through that horizon;
- whether the current value is complete, partial, or unavailable;
- whether late events or provider corrections can still revise it.
AppLovin’s advertiser API makes the distinction explicit at request time. Its documentation says metrics are realtime by default and that day_column=day retrieves cohort metrics. The API also documents separate revenue and ROAS fields for named horizons. A pipeline that mixes the default event timing with serve-date cohort values can compare different populations while displaying the same date.
Use recent D0 or partial D7 results as early signals when the decision requires speed. Do not present them as mature outcomes. The correct tradeoff is visible uncertainty, not a delayed decision disguised as certainty.
Recompute ratios instead of averaging rows
ROAS is non-additive. When a view groups several assets, recompute the ratio from aligned revenue and spend:
group ROAS = total aligned attributed revenue / total aligned ad spend
Do not calculate the arithmetic mean of asset ROAS values.
| Creative | Spend | Attributed revenue | ROAS |
|---|---|---|---|
| A | $80 | $40 | 0.50 |
| B | $20 | $5 | 0.25 |
| Correct combined result | $100 | $45 | 0.45 |
The arithmetic mean of 0.50 and 0.25 is 0.375. It gives the smaller $20 row the same influence as the $80 row. The correct combined ROAS is 0.45 because the group earned $45 on $100 of spend.
The same rule applies to CTR, CPI, CPA, conversion rate, and other ratios. Sum valid components at the requested grain, then divide. Never average the displayed ratios.
Prove whether asset rows can be rolled up
Additive columns can be summed inside a valid scope. Non-additive rows cannot. The distinction depends on how the source reports a multi-asset ad and how a reporting system constructs missing outcomes.
Google’s App campaign asset-reporting documentation provides a clear cross-provider warning. It says an ad can contain more than one asset, so one impression may be counted across more than one asset row. It also warns that the sum of asset spend may not match campaign spend.
Do not generalize Google’s behavior to every provider. Use it as proof that an asset label does not guarantee additive rows.
The size of the gap is worth measuring rather than assuming. On AppLovin, where both the asset report and the creative-set report come from the provider, sum the asset rows inside one creative set and compare the total with the set's own spend; the documented asset fields do not promise a partition, and a day on which several assets delivered is where the two can diverge.
Ask the system owner to demonstrate three things:
- Which columns are additive at asset grain?
- Which independent fact supplies campaign and account totals?
- What visible warning prevents a user or exported query from summing non-additive rows?
If those answers are unavailable, use the asset table only for the explicitly supported row-level decision. Obtain campaign and account totals from a separate additive source.
Keep attribution separate from causal creative lift
Attributed revenue answers a reporting question: which outcome did the chosen measurement system assign to this asset or context? Causal lift answers a different question: how much revenue would have disappeared if the creative had not run?
An asset can receive more spend because the network expects it to perform well. It can also run in a stronger country, audience, placement, campaign, or season. A higher attributed ROAS does not isolate the creative from those conditions.
On networks where the engine allocates budget, that confound is the default rather than the exception. Creative testing on AppLovin measures how far the spend ranking diverges from the return ranking and sets out what a comparison can still support.
Use language that matches the evidence:
- Observed: the source directly reported the value at the stated grain.
- Associated: the asset and outcome moved together inside the measured scope.
- Attributed: the measurement system assigned the outcome under named rules.
- Estimated or modeled: the system calculated a value that the source did not report directly.
- Causal: a valid experiment or identification strategy estimated the difference created by the asset.
Most weekly creative decisions do not require a causal estimate. They do require honest attribution language, like-for-like comparisons, sufficient delivery, and a recorded hypothesis for the next test.
Run five checks before you scale or pause
Use the result differently depending on which gates pass:
| Result | Safe action | Unsafe conclusion |
|---|---|---|
| Reported delivery, immature outcomes | Keep collecting evidence or make a bounded early test | The asset is a mature ROAS winner |
| Aligned, mature, additive outcome data | Compare the asset inside the declared scope | The result will transfer unchanged to every market or campaign |
| Reconstructed or modeled asset outcome with visible provenance | Use it within the system’s documented decision boundary | The provider reported the outcome directly |
| Non-additive asset rows | Rank or inspect rows only as documented | Sum them into campaign revenue or spend |
| Attributed performance without an experiment | Scale, pause, or iterate as an operational decision | The creative independently caused the measured lift |
A practical review record should save the selected horizon, source freshness, comparison scope, minimum delivery rule, decision, and expected follow-up. That record turns a dashboard reaction into a testable operating process. When the question is whether a previously strong asset is declining rather than how it ranks today, apply the creative fatigue measurement protocol before pausing it. When the question moves up a level, from which asset won to which creative choice inside it won, attribute comparisons need their own evidence rules because grouping assets by a tag changes what the sample size is. And before any asset-level ROAS column decides a budget, it is worth re-ranking the same assets on the two halves of the fortnight to see how much of that ranking reproduces.
Lemon fills the missing outcome columns without hiding provenance
Lemon Creative Analytics provides a proprietary asset-level estimation and reconciliation system for supported networks that do not report every outcome at asset grain. It is available to every Creative Analytics user with a supported ad-network connection. Creative Analytics places network-reported delivery beside reconstructed outcome estimates, exposes named D0, D1, D3, and D7 horizons, and keeps higher-level totals on the appropriate additive facts.
The calculation method remains proprietary. The decision surface exposes what matters to the user: where a value came from, which horizon it represents, whether it is partial, and whether it can be aggregated.
Use Creative Analytics to compare assets across supported networks. Read the AppLovin creative reporting guide for the provider-specific field boundary and the measurement methodology for Lemon’s provenance, attribution, aggregation, and limitation rules.
Primary sources
On this page
- First identify who reported each number
- Align the scope before comparing creatives
- Match the ROAS horizon to the cohort’s maturity
- Recompute ratios instead of averaging rows
- Prove whether asset rows can be rolled up
- Keep attribution separate from causal creative lift
- Run five checks before you scale or pause
- Lemon fills the missing outcome columns without hiding provenance
Related product