
iOS creative measurement
Apple returns the creative digits only in the first postback. Your day 7 and day 35 signal always comes back two digits wide, at campaign grain.
Apple returns the digits that could identify your creative only in the first postback. Every postback that carries a day 7 or day 35 signal comes back two digits wide, which is campaign grain. That is not a reporting gap any vendor can close. It is the specification, it is identical in SKAdNetwork and AdAttributionKit, and it means a creative-level D7 ROAS figure for iOS traffic was assembled somewhere other than Apple’s postbacks.
The useful response is not to give up on iOS creative decisions. It is to stop asking one number to do two jobs. This page shows exactly what each postback returns, what your network report still tells you, and how to split the creative decision from the revenue decision so both stay defensible. Every Apple, AppLovin, and Google fact below was read from the provider’s own documentation on August 22, 2026.
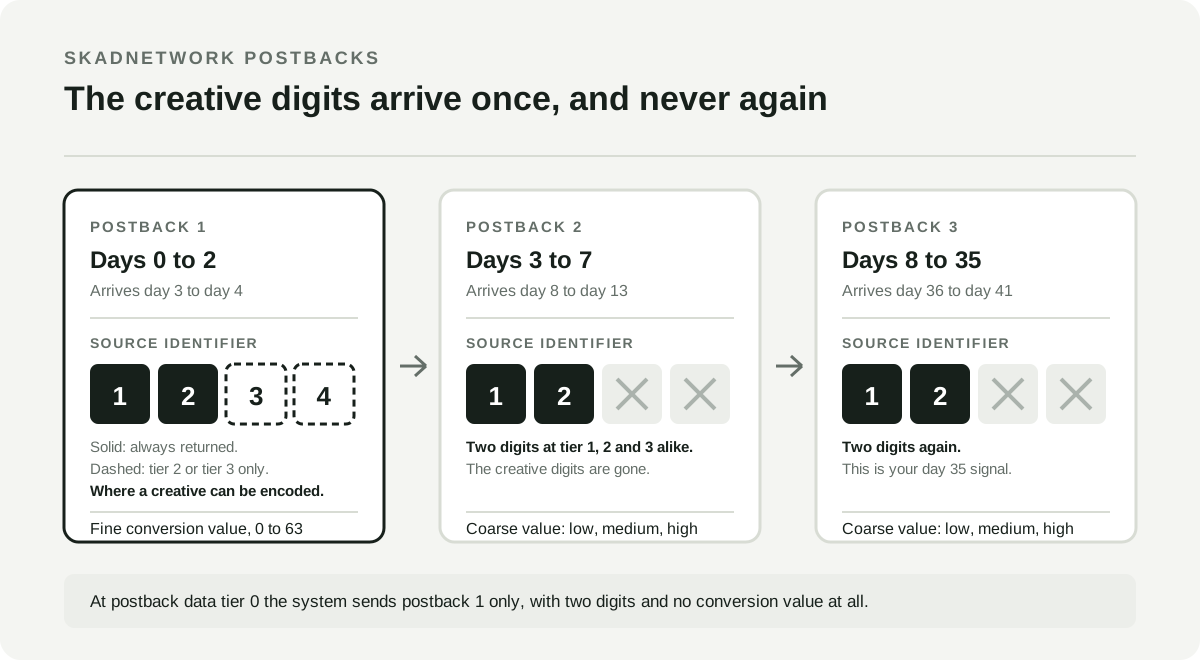
The digits that can carry a creative and the postbacks that carry monetization never overlap.
Apple sends the creative digits once, then stops
Under SKAdNetwork 4 and AdAttributionKit, the field that used to be the campaign identifier is the hierarchical source identifier. Apple’s property reference describes it as “a four-digit integer that ad networks define to represent the ad campaign” and says you “can encode information about your advertisement in each set of digits.”
That sentence is where the industry’s creative-level hope comes from, and the next one is where it ends. Apple: “you may receive two, three, or all four digits of the [source identifier] in the first winning postback, depending on the ad impression’s postback data tier.”
In the first winning postback. Apple restates the boundary in the conversion-window documentation, and it is unambiguous. Its sentence for the later windows reads: “For ads in Tier 1, Tier 2, and Tier 3, the second and third postbacks contain,” followed by two items and only two. The first is the source-identifier, described there as “the hierarchical source identifier with two digits.” The second is the coarse-conversion-value, “the coarse conversion value, if the app provides one.”
Tier 1, Tier 2, and Tier 3. There is no tier at which the later postbacks carry more than two digits. The AdAttributionKit documentation repeats the sentence word for word, so migrating to Apple’s newer framework does not change it.
Now line that up against the conversion windows. The first spans days 0 to 2 from first launch, the second spans days 3 to 7, and the third spans days 8 to 35. Everything you encoded into windows 2 and 3 arrives attached to two digits: the purchase, the subscription conversion, the day 7 retention proxy, whatever your conversion-value mapping was built to detect.
So the two things a creative decision needs, the identity of the creative and the value of the users it brought, are structurally separated. You can have one per postback. You can never have both in the same one.
The identifier you split is the identifier you lose
The obvious workaround is to spend the digits well: reserve digits 1 and 2 for the campaign and digits 3 and 4 for a creative group. That is what most ad-network implementations do. It is worth doing, and it is weaker than it looks, because of how Apple picks the tier.
Apple states the inputs plainly: “The postback data tier takes into account the crowd size associated with the app or domain displaying the ad, the advertised app, the country the advertised app was installed in, and the hierarchical source identifier that the ad network provides.”
Then the selection rule: “The system computes the postback data tier for the two-, three-, and four-digit hierarchical source identifiers. It selects the source identifier with the highest postback data tier. If multiple source identifiers share the highest postback data tier, the system selects the source identifier with the most digits. If the highest postback data tier is Tier 1 or Tier 0, the system selects the two-digit source identifier.”
Read those two together. The identifier is an input to the tier, and the tier decides how much of the identifier you get. Splitting your traffic across more source-identifier values makes each value’s crowd smaller, and a smaller crowd is what pushes a download toward a lower tier. This is an inference from the documented rule rather than a sentence Apple writes, but it follows directly: the finer you slice, the more likely Apple answers with the coarse slice you were trying to avoid.
The cost is not only the digits. At Tier 1 you also drop from the fine conversion value to the three-valued coarse one, and at Tier 0 you lose the conversion value entirely and receive no second or third postback at all. Chasing creative granularity in the identifier can quietly cost you the monetization signal that made the campaign worth measuring.
What each postback actually carries
Every cell below is Apple’s own description of the first, second, and third postbacks, read on August 22, 2026. “Digits” is the number of source-identifier digits returned.
| Postback data tier | Postback 1, days 0 to 2 | Postbacks 2 and 3, days 3 to 7 and 8 to 35 |
|---|---|---|
| Tier 3 | 2, 3, or 4 digits. Fine conversion value. Source app id or source domain. Country code when the country crowd is also Tier 3. | 2 digits. Coarse conversion value. |
| Tier 2 | 2, 3, or 4 digits. Fine conversion value. | 2 digits. Coarse conversion value. |
| Tier 1 | 2 digits. Coarse conversion value. | 2 digits. Coarse conversion value. |
| Tier 0 | 2 digits. No conversion value. | Not sent. |
Two consequences deserve stating on their own.
Creative resolution is rationed by crowd size, and Apple will not tell you the price. Crowd size is one of the named inputs to the tier, and Apple’s only picture of how tiers relate to crowd sizes is labelled “for illustrative purposes only.” No threshold is published for any tier, so nothing in the documentation lets you predict which of your campaigns land where. The direction is still clear enough to plan against, and it runs the wrong way: the campaigns where you most need to know which creative worked, the new ones and the small ones, are the campaigns least likely to tell you.
Geography drops out before creative does. The country code appears only at Tier 3. A per-creative, per-country iOS read is two independent censorship gates deep.
The timing is documented too, and it compounds the problem. Apple applies a random delay of 24 to 48 hours before the first postback and 24 to 144 hours before the second and third. A day 7 signal lands between day 8 and day 13 after first launch, and a day 35 signal lands between day 36 and day 41. The attribution windows comparison covers what those windows do to an outcome column, including why a SKAdNetwork “D7 revenue” figure is a private mapping over a three-valued symbol. This page is about the other axis: not when the number settles, but how far down it resolves.
Your network report still ranks creatives, just not on revenue
None of the above touches the ad server. Impressions, clicks, CTR, and spend are facts the network records when it serves your ad. They are not attributed and they need no postback, so they arrive at whatever grain that network’s own asset reporting offers, on iOS exactly as on Android.
That is the half of iOS creative measurement that still works, and it is not a small half. It is also narrower than most teams assume, in a specific way that is worth checking on your own networks.
Take AppLovin. Its Asset Reporting API, read on August 22, 2026, documents these dimensions: asset_id, asset_name, asset_url, campaign, campaign_id, campaign_package_name, creative_set, creative_set_id. Its documented metrics are impressions, clicks, ctr, and cost.
There is no platform dimension. Not iOS, not Android, not OS. The asset endpoint cannot separate the two, and it reports no installs, purchases, or revenue at any grain. So on AppLovin, an asset’s CTR is a blend across every platform that asset ran on, and the only way to read an asset’s iOS delivery is to have run it in a campaign that was iOS-only.
Google states the campaign-level boundary directly. Its documentation for SKAdNetwork reporting in App campaigns says “the SKAN report provides a customizable campaign-level view of your install and post-install in-app conversions and conversion values.” The same page describes what happens under the tier gate: conversion values “may not return when postback data has not passed the necessary privacy tier threshold, and these limitations may result in ‘unavailable’ conversion value fields.” Google then redistributes what it can, and says plainly that afterwards “some ‘unavailable’ conversions may be left. These values could not be redistributed based on available data.”
That last sentence is worth reading twice. Some of the SKAN numbers in the Google Ads interface are redistributed rather than received, and the residue that could not be redistributed is still missing. Google’s separate guide to iOS app campaign measurement places modeled conversions in “campaign and ad group tables.” Ad group, not asset.
Apple’s own attribution API stops at the ad group
If per-creative iOS attribution were possible for anyone, it would be possible for Apple on its own ad platform, where Apple is both the network and the operating system.
It is not. Apple’s attribution documentation for Apple Ads says the AdServices attribution API “provides a privacy-centric solution that supports campaign, placement, ad group, and keyword-level attribution.” Campaign, placement, ad group, keyword. That is a per-install response, and Apple documents no postback data tier for it at all; the only payload variation it describes is whether the click or impression date is included, which depends on App Tracking Transparency consent. No crowd anonymity, no aggregation, no delay, and it still stops above the individual creative.
Two useful conclusions follow. First, when a vendor offers iOS creative-level outcomes, the granularity came from campaign structure, from modeling, or from data the vendor collected inside your app, and it is fair to ask which. Second, nobody is holding out on you. There is no premium tier of the iOS ecosystem where per-creative revenue attribution exists.
Two decisions, two grains
The practical fix is to stop treating “which creative should I scale on iOS” as one question with one number behind it. It is two questions, they resolve at different grains, and the evidence for each is different.
Decision one: is this creative worth more delivery? Grain: the asset. Evidence: network-side delivery and engagement, unaffected by any of the above. CTR, IPM where the network reports installs at asset grain, video completion, and cost. Compare an asset against its siblings inside the same creative set and campaign, because that is the only comparison where the delivery context is held roughly constant.
Decision two: is this campaign earning back its spend? Grain: the campaign, or whatever the first two source-identifier digits encode. Evidence: SKAN conversion values under a fixed mapping you control, your own server-side revenue where the user is identifiable, and your MMP’s modeled view. Never per creative.
Write the rule down before you need it, because the pressure to cross the two arrives with the first weak week. A workable version:
- A creative may be scaled or cut on delivery evidence alone, inside a fixed campaign structure, provided the structure did not change during the comparison window.
- A campaign may be scaled or cut on outcome evidence, at campaign grain, once the relevant postback window has closed and the delay has elapsed.
- A creative may never be cut on an outcome figure that was distributed to it from a campaign-grain fact, because that figure moves when the campaign’s mix moves and not when the creative changes.
- Any iOS figure that appears to be per-creative revenue must name its source before it enters a decision.
Rule 3 is the one that gets broken, and the asset-level ROAS audit covers the provenance and aggregation checks that catch it on any platform.
What campaign structure buys, and what it costs
On iOS, campaign structure is the measurement instrument. It is the only thing that decides what the first two digits mean, whether an asset’s delivery can be read as iOS delivery, and how large each crowd is.
The tradeoff is real in both directions, so treat it as a budget rather than a setting.
Splitting more finely buys you: a platform-separable delivery read on networks whose asset endpoints have no platform dimension, cleaner geo separation, and more creative groups addressable in digits 3 and 4.
Splitting more finely costs you: smaller crowds per identifier, which risks the tier, which risks the digits and the fine conversion value together. It also costs you optimization efficiency, since most bidding engines need volume per campaign to learn.
There is one dated external figure worth knowing while you decide. AppsFlyer analyzed 240 million SKAN 4 postbacks across more than 2,000 apps between August 2023 and January 2024, published February 15, 2024, and reported that 82% of Tier 2 postbacks and 76% of Tier 3 postbacks carried four source-identifier digits, estimating roughly 20 installs per campaign per app per day as the level at which Tier 2 or 3 was reached with 97% certainty. That is a measured observation on a specific population two and a half years ago, not a current benchmark and not a threshold to adopt. Use it as an order of magnitude for how much volume a source-identifier value needs before splitting it again, then verify against your own postbacks.
“Just test creatives on Android” is right about outcomes and wrong about delivery
The best-known version of this advice comes from UA consultant Matej Lancaric, who told PocketGamer.biz on March 17, 2023: “If you’re testing creatives on iOS, just stop.” His reasoning was that Android carries lighter restrictions and is the more fertile testing ground, and that finished creatives should then move to iOS.
On outcomes he is right, and this page is the specification-level reason why. If your test needs to know which creative produced the higher-value users, iOS cannot answer at creative grain and Android can.
On delivery he is incomplete, and the gap matters. An iOS audience is not an Android audience. Device mix, price sensitivity, store behavior, and competitive pressure in the auction all differ, and CTR and IPM at asset grain are fully observable on iOS. A creative that wins on Android and loses iOS delivery is a finding you can measure today, without a single postback, and it is exactly the finding a pure Android testing program will never surface.
So the refinement is: run the outcome-dependent half of your testing program on Android, and keep a delivery-only creative read running on iOS, judged on engagement rates and never on reconstructed revenue. Then be explicit that the second one cannot rank creatives by user value, which is what the rule set in the previous section is for.
What this page does not establish
- It does not say how much iOS revenue signal you are losing. Apple publishes no tier thresholds, so the share of your traffic at each tier cannot be derived from documentation. Measure it in your own postback logs.
- It covers Apple, AppLovin, and Google as documented on August 22, 2026. Other networks differ, documentation changes, and anything load-bearing deserves a re-check before a large budget move.
- It says nothing about which internal source a given network uses to produce its iOS outcome columns. Networks combine SKAN, their own SDK data, and MMP integrations, and that mix is not documented per network. Ask your account team rather than assuming.
- It does not establish that any creative caused any outcome. Attribution assigns credit under a rule; the same limit applies on Android, where the data is merely better.
- The claim that a finer identifier split lowers your tier is an inference from Apple’s documented selection rule, not an Apple statement. It is the direction the rule implies, and the size of the effect is not documented.
How Lemon reports iOS asset metrics
Lemon’s asset-level numbers are a documented reconstruction, and on iOS the reconstruction rests on exactly the boundary this page describes. Saying so is more useful than pretending otherwise.
For AppLovin, asset identity and asset delivery come from the Asset Reporting API at campaign, creative set, asset, and date grain, which is provider ground truth and carries no platform dimension. Outcomes and the iOS or Android split come from the advertiser report, at campaign, creative set, country, platform, creative format, and date grain. Asset-level country and platform figures are then produced by proportional distribution from the advertiser report.
Lemon’s own algorithm document states the limit that follows: the Asset API has no country or platform dimension, so every sibling asset receives the same advertiser-derived geography and platform distribution, scaled by its own total. The network’s optimizer may genuinely have shown different assets to different audiences, and the available data cannot observe that. The same document forbids summing asset rows to produce additive campaign or account totals, because those estimates are deliberately non-additive.
What that buys a UA team is a per-asset iOS view that is honest about where each column came from, rather than a blended figure whose iOS half quietly turns out to be a campaign-grain number wearing an asset’s name.
See Creative Analytics for asset-level performance across connected networks with provenance kept visible, the mobile app creative analytics guide for the cross-platform version of the decision, and the measurement methodology for Lemon’s full rules on provenance, attribution, aggregation, and limitations.
Primary sources
- Apple: SKAdImpression sourceIdentifier
- Apple: receiving postbacks in multiple conversion windows (SKAdNetwork)
- Apple: identifying the parameters in install-validation postbacks
- Apple: receiving postbacks in multiple conversion windows (AdAttributionKit)
- Apple: AdAttributionKit
- Apple: SKAdNetwork
- Apple Ads: measuring ad performance
- Apple: AdServices
- AppLovin Asset Reporting API
- Google Ads Help: SKAdNetwork install and in-app event reporting for iOS App campaigns
- Google Ads Help: understanding iOS app campaign measurement and reporting
- AppsFlyer: SKAN 4 postback data learnings
On this page
- Apple sends the creative digits once, then stops
- The identifier you split is the identifier you lose
- What each postback actually carries
- Your network report still ranks creatives, just not on revenue
- Apple’s own attribution API stops at the ad group
- Two decisions, two grains
- What campaign structure buys, and what it costs
- “Just test creatives on Android” is right about outcomes and wrong about delivery
- What this page does not establish
- How Lemon reports iOS asset metrics
Related product