
Creative test reliability protocol
A reader-run protocol for deciding how much delivery a creative needs before you scale it: rank each half of the fortnight, count the overlap, and compare it with chance.
A creative ranking is safe to act on when it reproduces on data it was not selected from. You can measure that on your own account this week: split one fortnight into odd and even calendar days, rank the same creatives on each half, and count how many of the top quarter appear in both. Under no signal at all, about one in four will. If your overlap does not clear that line, the table you are about to scale from is a table of noise, and the fix is more pooling, a higher delivery floor or a different column, not a bigger budget for the current winner.
The question people actually search is "how much spend does a creative need before I can judge it". The honest answer is that no dollar figure works across accounts, because the network chose how much each creative spent. Every threshold in the pages Google returned for that question in September 2026, $100 to $300 per creative, 100 conversions per variant, 10,000 impressions, three to five days at 90% confidence, is a sample-size rule for a randomised experiment, imported into a setting where nothing was randomised, and none of them cites a dataset. This page replaces the borrowed number with a measurement you run.
Why "spend per creative" is the wrong question
In an ordinary user-acquisition campaign the engine decides which creative gets the next impression. Unity says so in its own documentation: its Creative Testing campaign type exists because, "unlike other User Acquisition campaigns", it is "designed to give each creative pack a fair opportunity to serve impressions". Ordinary campaigns are not. AppLovin's engine allocates spend across a creative set's assets with no lever and no explanation, which is why a spend ranking on AppLovin is an output of the engine's decision, not a measurement of creative quality. Meta describes its own delivery system as "exploring the best way to deliver your ad set" until about 50 results have accrued, and warns that results during that period "aren't necessarily indicative of future performance"; the exploring is done with your creatives, and the system "learns less about each ad" the more ads you give it.
Two things follow. First, the creatives in your table did not receive comparable exposure, so "100 conversions per variant" was never going to happen for the variants the engine disliked. Second, a favoured creative's numbers are built on more events than a starved one's, so the ranking mixes real quality differences with differences in how much evidence each row carries. A sample-size calculator cannot see either problem. A reproduction test can.
The test in one paragraph
Take every creative that delivered in the same app, platform, country scope and network over one fortnight. Split the fortnight into its odd calendar days and its even calendar days. Compute the column you act on, cost per install or IPM or D7 ROAS, separately for each half. Rank the creatives on each half. Take the top quarter on the odd-day half and count how many of them are also top quarter on the even-day half. That count, out of the top-quarter size, is your reproduction rate. Compare it with what chance alone would produce.
The split is by alternating days rather than first week against second week on purpose. Both halves then share the same weekday mix, the same creative ages, the same budget changes and the same market conditions. A week-against-week split confounds reproduction with drift: fatigue, a new batch entering, a budget cut. Alternating days isolates the question you asked, which is whether the ranking is stable on data of this volume.
Protocol v1.0, step by step
- Fix the unit and the scope. One grain, the one you make decisions at: asset or creative set on AppLovin, creative pack on Unity, ad on Meta. One app, one platform, one country scope, one network. Mixing grains or markets manufactures both agreement and disagreement.
- Take one complete fortnight. Fourteen days whose outcomes have matured for the column you will rank on. For D7 ROAS that means the fortnight ended at least seven days ago, plus whatever lag the network needs to stop restating the column. The attribution window comparison sets out when each network's figure stops moving.
- Split by alternating calendar days. Days 1, 3, 5 and so on form half A; days 2, 4, 6 and so on form half B. Seven days each.
- Apply a delivery floor to both halves. Keep a creative only if it clears a minimum in each half, for example 5,000 impressions and $50 of spend per half. The floor is yours to set; its job is to exclude rows whose rate is undefined or built on a handful of events. Write down how many creatives survive. That number, n, decides how strong a result you need.
- Rank each half on the column you act on. Compute the metric inside each half from that half's own spend, impressions, installs and outcomes. Do not rank the fortnight total and then look at the halves.
- Count the top-quarter overlap. With n creatives the top quarter holds k, where k is n divided by four, rounded to the nearest whole number. Count how many of half A's top k are in half B's top k.
- Compare with chance. The expected overlap under no signal is k squared divided by n, which is k divided by four when k is a quarter of n: one in four of the top quarter, whatever the column, whatever the account. The next section gives the exact probabilities.
Keep the ledger. The point of the protocol is that the same reading can be taken next fortnight and the one after, and that the readings drift as volume and creative mix change.
The chance line, exactly
Suppose the ranking carries no information. Then half B's top quarter is a random draw of k creatives from n, and the number that coincide with half A's top quarter follows the hypergeometric distribution. The arithmetic is short enough to check by hand. With 16 creatives and a top quarter of 4, there are 1,820 ways to choose 4 of 16. Exactly 3 of half A's top 4 can be chosen in 4 times 12 equals 48 ways, and all 4 in 1 way, so the probability of 3 or more shared by chance is 49 divided by 1,820, which is 2.7%. Two or more shared: 445 divided by 1,820, which is 24.5%.
| Creatives above the floor (n) | Top quarter (k) | Expected overlap by chance | Overlap that is unlikely by chance | Probability by chance |
|---|---|---|---|---|
| 8 | 2 | 0.5 | 2 of 2 | 3.6% |
| 12 | 3 | 0.75 | 3 of 3 | 0.5% |
| 16 | 4 | 1.0 | 3 of 4 | 2.7% |
| 20 | 5 | 1.25 | 4 of 5 | 0.5% |
| 24 | 6 | 1.5 | 4 of 6 | 1.8% |
| 32 | 8 | 2.0 | 5 of 8 | 1.2% |
| 40 | 10 | 2.5 | 6 of 10 | 0.7% |
The fourth column is the smallest overlap whose chance probability is below 5%. Read it as the bar a single reading must clear before the ranking deserves the word "winners". With 12 creatives the bar is all three, which tells you something useful before you run anything: a small table cannot produce a convincing reading in one fortnight, however good the creatives are. The remedy is more creatives above the floor, or several fortnights read in a row.
One reading is one draw. A ranking that clears the bar in three consecutive fortnights is beyond coincidence; a ranking that clears it once and sits at chance twice is a ranking to distrust. Ties are rare on a cost column and can be broken by spend; if they are common, the floor is too low.
A worked example on a synthetic ledger
All numbers in this section are synthetic teaching examples, not customer results or benchmarks. The ledger has 16 creatives in one app, one platform, one country and one network, with roughly 12,000 impressions per creative per half at a $10 CPM, so about $120 of spend per half per creative. Every creative clears a floor of 5,000 impressions and $50 in both halves, so n is 16 and k is 4.
| Creative | Odd days: installs | Odd days: spend | Odd days: CPI | Odd-day rank | Even days: installs | Even days: spend | Even days: CPI | Even-day rank |
|---|---|---|---|---|---|---|---|---|
| C01 | 104 | $124.00 | $1.19 | 2 | 101 | $128.00 | $1.27 | 2 |
| C02 | 62 | $118.00 | $1.90 | 13 | 71 | $122.00 | $1.72 | 7 |
| C03 | 70 | $131.00 | $1.87 | 12 | 60 | $126.00 | $2.10 | 14 |
| C04 | 55 | $109.00 | $1.98 | 15 | 52 | $114.00 | $2.19 | 15 |
| C05 | 98 | $120.00 | $1.22 | 3 | 84 | $116.00 | $1.38 | 3 |
| C06 | 75 | $135.00 | $1.80 | 9 | 100 | $139.00 | $1.39 | 4 |
| C07 | 64 | $112.00 | $1.75 | 7 | 57 | $108.00 | $1.89 | 10 |
| C08 | 84 | $127.00 | $1.51 | 5 | 66 | $133.00 | $2.02 | 11 |
| C09 | 93 | $115.00 | $1.24 | 4 | 78 | $121.00 | $1.55 | 5 |
| C10 | 61 | $129.00 | $2.11 | 16 | 68 | $123.00 | $1.81 | 9 |
| C11 | 58 | $106.00 | $1.83 | 10 | 49 | $110.00 | $2.24 | 16 |
| C12 | 121 | $138.00 | $1.14 | 1 | 106 | $132.00 | $1.25 | 1 |
| C13 | 66 | $122.00 | $1.85 | 11 | 79 | $125.00 | $1.58 | 6 |
| C14 | 60 | $117.00 | $1.95 | 14 | 54 | $113.00 | $2.09 | 13 |
| C15 | 77 | $130.00 | $1.69 | 6 | 73 | $127.00 | $1.74 | 8 |
| C16 | 69 | $123.00 | $1.78 | 8 | 62 | $129.00 | $2.08 | 12 |
Top quarter on odd days: C12, C01, C05, C09. Top quarter on even days: C12, C01, C05, C06. Three of four shared, against one expected by chance and a 2.7% chance probability. The cost-per-install ranking on this ledger, at this volume, reproduces. C09 and C06 traded places, which is what a real fourth place looks like; the first three are the creatives to scale.
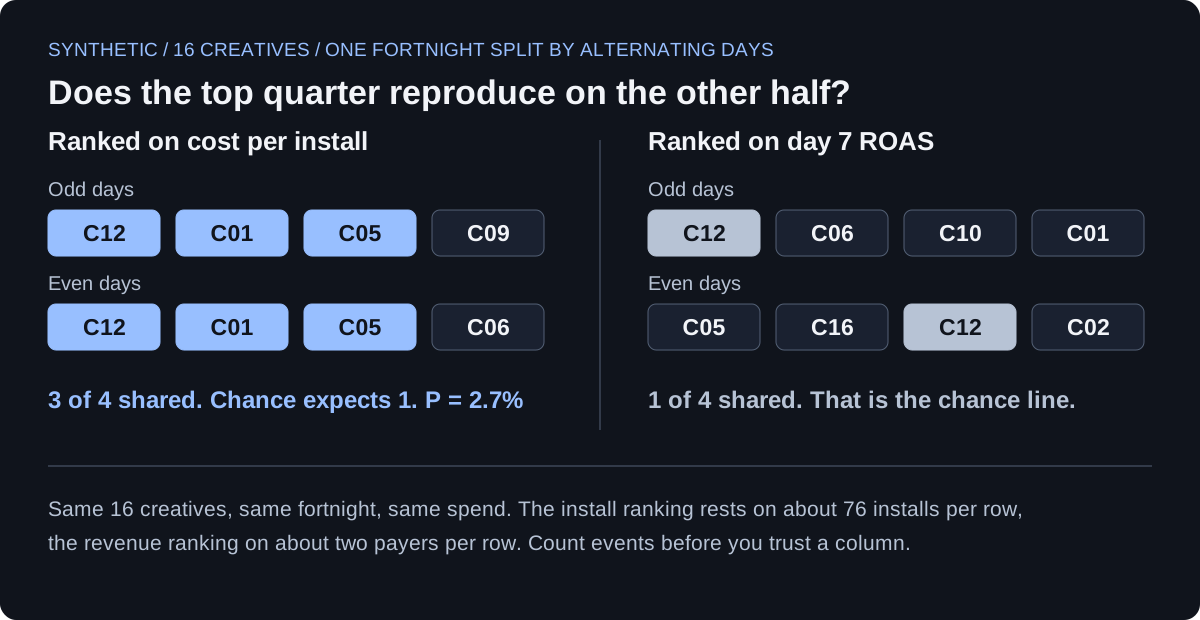
Now rank the same ledger on D7 ROAS. Across all 16 creatives the odd days produced 35 paying users and the even days 36, so a little over two payers per creative per half.
| Creative | Odd days: payers | Odd days: revenue | Odd days: D7 ROAS | Odd-day rank | Even days: payers | Even days: revenue | Even days: D7 ROAS | Even-day rank |
|---|---|---|---|---|---|---|---|---|
| C01 | 4 | $44.96 | 36.3% | 3 | 2 | $14.98 | 11.7% | 11 |
| C02 | 1 | $4.99 | 4.2% | 14 | 3 | $39.97 | 32.8% | 4 |
| C05 | 3 | $29.97 | 25.0% | 6 | 5 | $74.95 | 64.6% | 1 |
| C06 | 3 | $49.97 | 37.0% | 2 | 1 | $4.99 | 3.6% | 15 |
| C10 | 2 | $39.98 | 31.0% | 4 | 0 | $0.00 | 0.0% | 16 |
| C12 | 5 | $64.95 | 47.1% | 1 | 4 | $44.96 | 34.1% | 3 |
| C16 | 2 | $24.98 | 20.3% | 7 | 4 | $54.96 | 42.6% | 2 |
The table shows the seven creatives that reach either top quarter; the full ledger is in the same synthetic file as the CPI table. Top quarter on odd days: C12, C06, C10, C01. Top quarter on even days: C05, C16, C12, C02. One of four shared. That is exactly the chance line. C06 was second on one half and fifteenth on the other; C10 went from fourth to last on zero payers. The same creatives, the same fortnight, the same spend, and the ROAS ranking is noise.
Nothing about that is surprising once you count events. A rate built on about 76 installs has a Poisson coefficient of variation of one over the square root of 76, about 11%. A rate built on about two payers has one over the square root of two, about 70%. Half-to-half swings of 70% reorder any table. The CPI ranking reproduced because each row rests on tens of installs; the ROAS ranking failed because each row rests on a couple of purchases. That is arithmetic, not a property of this ledger, and it is why a revenue column needs far more pooling than an install column before its ranking means anything.
The selection trap the split protects you from
Look at the odd-day top four on the even days. On the odd days, the half that chose them, C12, C01, C05 and C09 cost $1.19 per install pooled. On the even days they cost $1.35, a rise of 12.7%. The whole 16-creative table moved from $1.61 to $1.69 over the same halves, a rise of about 5%. The extra seven or so points did not come from anything the creatives did. They came from choosing the four lowest numbers out of sixteen noisy ones: the chosen numbers are low partly because the creatives are good and partly because their noise happened to land low that week. On the other half, the noise lands wherever it lands.
This is the general fact that Gelman and Carlin describe as Type M error: in a noisy, small-sample setting, an estimate that passes a significance filter overstates the true effect, on average by a computable exaggeration ratio. Picking the top quarter of a noisy table is the same filter under another name, and applied to a creative table it produces a familiar experience. You pick the winners on a fortnight, scale them, and the following fortnight they look worse, in this ledger by 12.7%. It reads as fatigue. Some of it may be. A large part of it is that the fortnight that picked them flattered them, and the next one did not. Creative fatigue analysis sets out how to separate a real decline from this and the other look-alikes.
The split protects you because the reading never judges a creative on the half that selected it. When you scale C12, C01 and C05, the expectation you carry is their even-day cost, not their odd-day cost. And when you measure decay later, measure it against a selection-free baseline, never against the window that chose the winner.
Turning the reading into your own threshold
The reproduction rate is the instrument; the pooling sweep is how it answers "how much data".
- At chance on the column you act on. Do not scale from this table. Pool longer: split 28 days by alternating days instead of 14, or read two fortnights back to back. Raise the floor so that every surviving row rests on more events. Or act on a column with more events per row, an install rate rather than a purchase rate, while the outcome column matures.
- Clears the bar on CPI, at chance on D7 ROAS. The install ranking can carry install decisions. The revenue ranking cannot carry revenue decisions yet. Scale on CPI only where you have separately confirmed that installs from these creatives monetise alike; otherwise keep pooling the revenue column until it reproduces.
- Clears the bar three fortnights running. This grain, floor and window are enough for this account. The window length you landed on is your answer to "how much data does a creative need", derived from your own delivery rather than borrowed.
Sweep in both directions. If 14 days clears the bar comfortably, try 7 days split by alternating days; if that also clears it, you can read weekly and act sooner. If 14 days is at chance, 28 is the next reading. The shortest window that clears the bar is the review cadence, and it moves: re-run the sweep when daily volume changes materially or a large new batch enters.
The same instrument settles two related questions. Run it at asset grain and again at creative-set grain before assuming the coarser unit repairs a column that fails at the finer one; pooling assets can hide a failing ranking as easily as fix it. And run it across a border: rank a country's own odd days against its even days, then rank the pooled global odd days against that country's even days. If the country's own half predicts its other half better than the global ranking does, the market deserves its own test; if not, the global list transfers. Either way you have measured it rather than assumed it.
What this test cannot tell you
Reproduction is not causation. A ranking can reproduce because the engine kept favouring the same creatives in both halves, feeding them the audiences and placements it had already learned convert. The test then confirms that the report is stable, not that the creative is better. On allocated networks that is the ceiling of what any observational comparison can prove, and the AppLovin testing page sets out what can and cannot be concluded from one. Where the network offers a fair-delivery mode, Unity's Creative Testing campaigns for instance, use it for the comparison and this protocol for reading it.
Alternating days remove most drift, not all of it. A creative that entered on day 9 has less delivery in both halves, and a budget change on day 6 hits both halves unequally for the rest of the fortnight. The floor handles the first case; note the second and read the next fortnight.
The floor changes n. A stricter floor drops the noisiest rows and raises the bar you need, since a smaller table needs a larger share of its top quarter shared. Choose the floor for the events it guarantees, then read the bar for the n it leaves.
On iOS, the outcome half of the comparison may not exist at creative grain at all. Apple returns the digits that can encode a creative only in the first postback, so a day 7 signal always arrives at campaign grain; what Apple's postbacks return covers which half of an iOS creative comparison still carries evidence.
And the test says nothing about which creative to make next. Once the ranking reproduces, inspect the attributes of the creatives that hold with the sample counted in creatives, and write the next test as a brief with one changed decision and result branches declared before launch.
Where Lemon fits
The protocol needs one thing from a reporting system: creative-by-day rows under a fixed scope. In Lemon's Creative Analytics the date-range filter and export produce them, and the read-only API and MCP accept date in group_by, so an analyst or an agent can pull the fortnight at day grain and split it in a spreadsheet or a notebook. The read-only MCP workflow shows the scope-first sequence that keeps the rows aligned before anything is ranked. Attribute comparisons in Lemon count the sample in creatives rather than impressions for the reason this page keeps returning to: a finding is only as strong as the number of independent things it rests on.
Primary sources
- Unity Grow: Introduction to Creative Testing campaigns
- Unity Grow: Manage Creative Testing campaigns
- Meta Business Help Center: About the learning phase
- Gelman and Carlin, Beyond Power Calculations: Assessing Type S (Sign) and Type M (Magnitude) Errors, Perspectives on Psychological Science 9(6), 2014
- Wolfram MathWorld: Hypergeometric distribution