
Mobile UA budget decisions
Use marginal ROAS to examine a mobile UA budget increase, without mistaking a before-and-after comparison for proof of incremental revenue.
A campaign can clear its ROAS target while the next budget increase fails to earn back its cost. Average ROAS describes the whole spend. The scaling decision depends on the return from the increase, at the revenue horizon and cost basis your business requires.
Marginal ROAS names that next-spend question. But subtracting last week's revenue from this week's revenue does not tell you what the extra budget caused. Start with the subtraction, then identify the evidence it is missing.
The campaign still shows 120% ROAS
Consider two fictional mobile-app acquisition periods. Each lasts seven days. Both use the same app, platform, campaign scope, currency, attribution rules and revenue definition. Every acquired user's D30 window has finished, and both reports have settled. Revenue means attributed gross revenue earned through D30 by the users acquired in each period, not all revenue booked during that calendar week.
| D30 cohort measure | Earlier period | Later period |
|---|---|---|
| Acquisition spend | $10,000 | $15,000 |
| Attributed gross revenue | $15,000 | $18,000 |
| Average ROAS | 150% | 120% |
| Revenue less ad spend | $5,000 | $3,000 |
The later campaign still reports more revenue than ad spend. Yet spending rose by $5,000 and attributed revenue rose by only $3,000:
Observed return on the spend change
= ($18,000 - $15,000) / ($15,000 - $10,000)
= 60%
The subtraction exposes something the 120% average conceals. Revenue less ad spend fell by $2,000. That is an accounting warning worth investigating. It is not full profit: store fees, refunds and other costs have not been deducted. It is also not proof that the increase destroyed $2,000 of value.
All numbers in this article are synthetic teaching examples, not customer results or benchmarks.
Average, marginal and incremental answer different questions
| Measure | Question | Evidence needed |
|---|---|---|
| Average attributed ROAS | How much revenue did the report credit per dollar of total spend? | A consistent attribution report and revenue horizon |
| Observed return on a spend change | How did reported revenue change relative to reported spend? | Comparable observations; the ratio is undefined when spend does not change |
| Marginal ROAS | How much additional revenue would a small increase from the current spend level cause? | A credible estimate of the response to that increase |
| Incremental ROAS | How much revenue did a specified advertising intervention cause per dollar of the relevant spend? | An experiment or causal model with a defined comparison |
Google's Meridian documentation defines marginal ROI around a small change from historical spend, using a modeled counterfactual. When the outcome is revenue, this addresses the marginal revenue-return question. It is distinct from attributed ROAS in a dashboard.
Our $5,000 increase is 50% of the original budget. Even with a sound causal estimate, its return would describe the whole $10,000-to-$15,000 step. It would not establish the return on the next dollar above $15,000.
The missing number changes the answer
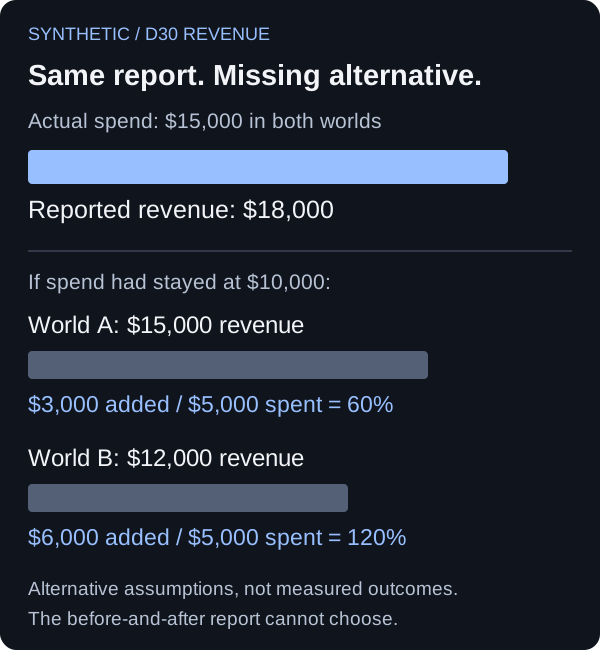
The earlier period's $15,000 revenue is observable. The later period's revenue if spend had stayed at $10,000 is not. That missing alternative is the counterfactual.
To isolate this problem, temporarily grant the fictional report perfect revenue measurement: assume attributed revenue equals the total revenue outcome we care about, with no credit moving between channels. Two possible worlds still fit the same before-and-after table:
| Later-period outcome | World A | World B |
|---|---|---|
| Revenue with the actual $15,000 spend | $18,000 | $18,000 |
| Revenue had spend stayed at $10,000 | $15,000 | $12,000 |
| Revenue caused by the $5,000 increase | $3,000 | $6,000 |
| Causal return on that increase | 60% | 120% |
In World A, the added spend produces less gross revenue than it costs. In World B, it produces more: without the increase, revenue would have fallen further. Neither world is inferred from the report. They are alternative assumptions, not confidence bounds.
In real reporting there is another question: did the budget create revenue, or change which campaign received credit for it? A consistent attribution definition helps comparison, but cannot by itself answer that causal question.
The useful conclusion from the original table is therefore: investigate the increase. Neither “keep scaling because ROAS is 120%” nor “reverse it because marginal ROAS is 60%” follows from those two rows alone.
Make the cohort comparison valid first
Before commissioning a test or fitting a response curve, make sure the apparent deterioration is not a reporting mismatch. Save these fields alongside each comparison:
- Acquisition dates and actual spend, rather than the configured budget alone.
- App, platform, campaign scope, countries and new-user versus re-engagement inclusion.
- Revenue horizon, reporting timezone, attribution definition and revenue basis.
- Cohort age, report retrieval time and whether revenue is observed or forecast.
- Concurrent bid, creative, targeting, product and monetization changes.
Compare equal-length acquisition periods at the same completed horizon. Comparing a settled D30 cohort with a younger cohort's partial revenue can manufacture deterioration. Cohort reporting lag, the days a network keeps restating a column after its window closes, adds a separate wait after the behavioral window.
Keep the money definition fixed too. Gross revenue, contribution after variable costs and cash received answer different questions. Mobile UA payback shows why a reported 100% ROAS is not automatically the point at which the business recovers its cash.
If country or creative mix changed because the higher budget reached different inventory, that change may be part of the effect you want to measure. Document it. Do not automatically adjust it away and then claim to have measured the full budget policy.
Test the budget change you intend to make
A test of advertising versus no advertising answers whether the tested advertising creates incremental value. A test of the current budget versus a larger budget answers whether the increase creates value. Those comparisons are not interchangeable.
For a causal test, define the current and proposed spending policies in comparable experimental units, with assignment and analysis designed to estimate their difference. Specify the outcome window, revenue basis, likely spillover between units and other changes held fixed. The revenue outcome should not depend solely on which campaign claimed a conversion.
Google's geo Conversion Lift guidance defines incremental ROAS using incremental conversion value and the cost difference between treatment and control. It also reports uncertainty and describes a cooldown period for collecting delayed outcomes. That supports the measurement principle; it does not mean every account has access to a study that tests its proposed budget step.
If an experiment is impractical, a causal response model is another route, provided its assumptions and spend range are defensible. A curve fitted to spend and revenue alone does not establish causality. Do not extrapolate an estimate around $10,000 into a promise about $50,000.
A simple two-period report remains useful when neither route is available. Treat it as a diagnostic. Any budget move based on it should carry an explicit loss limit and a plan to gather stronger evidence, rather than a claim of measured incremental return.
Lower ROAS can still leave more money
The original example loses ground on revenue less ad spend. That is not inevitable when average ROAS falls.
Change the later period's fictional revenue from $18,000 to $21,000. Average ROAS falls from 150% to 140%, while revenue less ad spend rises from $5,000 to $6,000. The observed return on the increase is now 120%. Lower average efficiency and a larger dollar remainder can coexist.
Choose the decision rule before seeing the result. If the revenue numerator is gross, let the retained contribution fraction represent the share left after the variable costs relevant to the increase. With an assumed constant fraction of 80%, gross incremental return must exceed 1 / 0.8 = 1.25, or 125%, just to cover added ad spend. The 120% example would fail that particular test. The 80% is an illustration, not a mobile-app benchmark, and the calculation excludes fixed costs and financing requirements.
Where an experiment or model returns an uncertainty interval, compare that interval with the declared hurdle. A result spanning both acceptable and unacceptable returns is unresolved evidence. The next action depends on the cost of more testing and the loss the business can tolerate, not on rounding the point estimate upward.
A cohort forecast does not forecast a different budget
A revenue forecast asks what an acquired cohort will earn. A budget-response estimate asks what would happen under a different acquisition policy. Predicting the first accurately does not establish the second.
Lemon's Cohort Prediction lets teams inspect forecasts at a selected horizon and choose a gross or net revenue basis. Those inputs help define the comparison. They do not turn a before-and-after report into an incrementality test.
Use a D7 ROAS target to assess an early cohort against its mature objective, and a forecast backtest to judge the forecast's reliability. For the broader measurement setup, start with cohort revenue forecasting.
When the budget decision arrives, write down the missing question explicitly: what would this same business have earned over the same outcome window if we had kept the current spending policy? That is the comparison an above-target ROAS cannot supply.